Exploring the Software Interface
The Interface Itself
Now that the Cinematronic Biosignal Platform is installed on your computer, our next step is to familiarise ourselves with the software's layout and understand how you will work within it. The interface has been designed to be straightforward, but the number of menus and options can seem overwhelming at first.
When you open the software, the first screen you encounter is the main dashboard. This is the hub of all activity, and it has been designed to resemble many video and image editors you may already be familiar with. In fact, students who have already worked with the Cinematronic Biosignal Platform found that the interface is intuitive and does not require advanced technical knowledge.
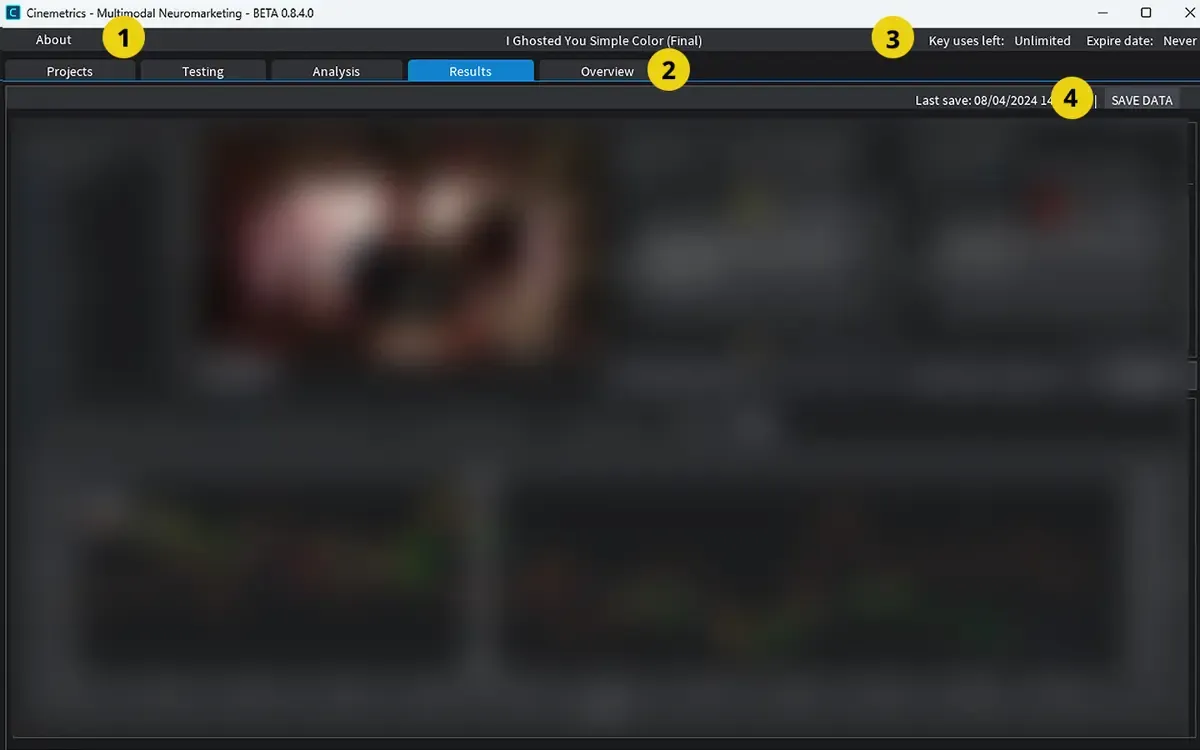
1) About, menu containing license information and software details. 2) Tab Menu, navigation between environments (Projects, Testing, Analysis, Results, Overview). 3) License Status shows key uses left and expiration date. 4) Save Indicator displays last save time and allows manual saving of data.
From here, you can create a new project or open an existing one. When you open a project, more features and tools are available to you:
- Testing Environment: This is where you connect devices for testing (to collect data, such as heart rate, PPG, eye tracking), manage participants, select media for testing, and begin your study.
- Analysis Environment: After running a study, this section enables you to view the data collected from your participants. You will see graphs of galvanic skin response (GSR), heart rate (derived from photoplethysmography, or PPG), or eye tracking, all aligned with the video timeline. You can also add annotations and connect survey responses here.
- Results Environment: Once you have data from more than one participant, this area allows you to normalise and compare multiple respondents, making it easier to see shared patterns.
- Overview Environment: This section provides a comprehensive review of the project as a whole, featuring summary charts and visualisations that combine both biosignals and questionnaire data.
At the top of the interface is the tab menu, which allows you to switch between these environments. We will examine the details of each section further later on.
The largest part of the screen is referred to as the workspace. It changes depending on what you are doing: if you are creating a project, it displays your list of videos; if you are in analysis mode, it transforms into a graphing and annotation tool.
At this point, you may notice many terms and menus that feel unfamiliar. Don't worry if you cannot yet imagine how everything will be used. For now, your task is to explore.
Creating your first project
Once you are comfortable with the interface, it is time to create your first project.
Inside the Biosignal Platform, click on New Project, and select Static Video. Give your project a clear and descriptive name. Once named, it will appear in the Projects Environment, where you can select and open it. At present, the software supports only static video projects of any length. This is ideal for testing trailers, short films, commercials, or clips from a longer project.
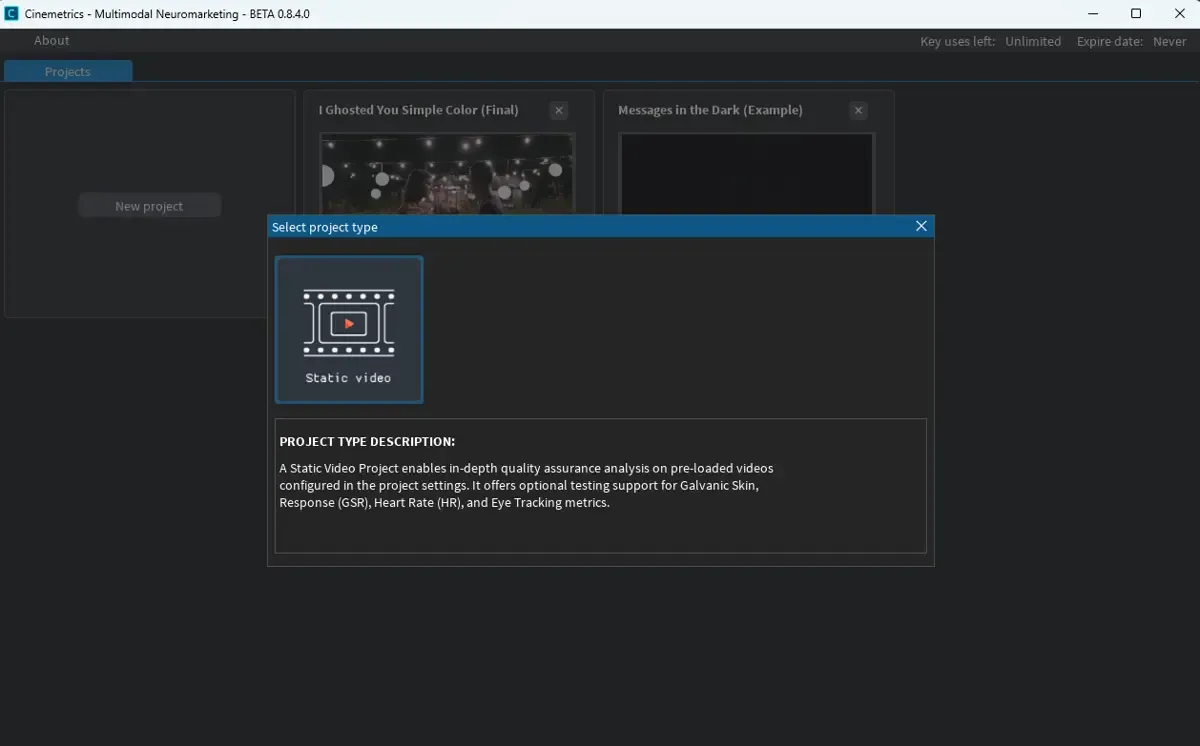
Currently, the software supports only static video projects of any length. This is ideal for testing commercials, trailers, movie clips, etc. More types of projects will be available in the future, including screen capture, pictures and documents, or mixed projects.
Click on the newly created project to open it. The workspace will now shift to show the project's contents and tools, preparing you for the next step: setting up the testing environment.
Setting up the Testing Environment
The Testing Environment is where you manage the practical aspects of your study. It guides you through a sequence of steps that ensure the setup is complete before testing begins. The first step is to select the video that will be shown to participants. The platform supports various common formats, including MP4, MKV, AVI, MOV, FLV, and WMV. To ensure smooth performance, particularly on laptops with lower specifications, it is recommended to use files with a resolution of 1080p or lower.
NOTE: Problems can sometimes arise if file names or folders contain unusual characters (e.g., @, #, $, %, é, ü, ç) may prevent recognition. In such cases, renaming the file with simple letters and numbers often resolves the issue.
The second step involves choosing which biosignals to collect and connecting the relevant hardware. The platform currently supports three types of data: galvanic skin response (also known as GSR/EDA), which reflects levels of physiological arousal; heart rate, derived from blood flow using photoplethysmography (PPG); and eye tracking, which indicates where participants direct their gaze on the screen.
To record GSR/EDA and heart rate, you will need access to a Shimmer3 GSR+ device. It is likely that your university already has such a device available in departments that work with psychology, media technology, or human-computer interaction, since these sensors are commonly used for research and teaching in those areas.
Once the devices are connected, the next step is to create or select the respondent who will participate in the test. Each participant requires a unique profile, which ensures that the data is correctly organised and stored. Selecting the wrong respondent can result in overwriting previous results, so it is good practice to create a new profile for each session and to double-check your settings.
Only once the video, devices, and respondent have been properly set does the "Start Test" button become available. Clicking it will launch the video in full-screen mode and begin the recording of the selected biosignals in the background. From this point, your study is underway.
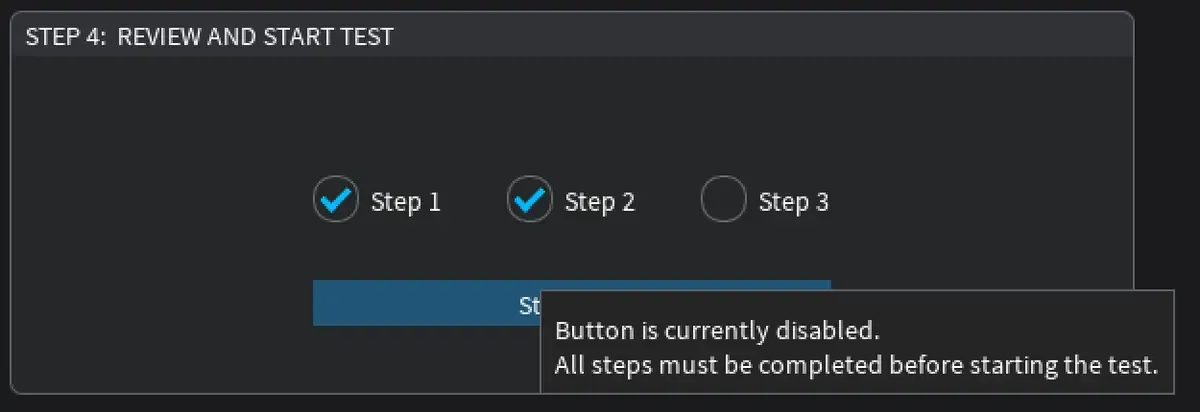
To start a test, three conditions must be met: 1) a video has been selected, 2) the chosen data types are linked to properly connected devices, and 3) a respondent profile has been created and selected.
What to do if you can’t select your video:
- Check the file name of the video. If it includes special characters (like accents, symbols, or non-English characters), try renaming it with simple letters and numbers.
- Avoid special characters such as: @, #, $, %, &, +, é, ü, ç or any non-standard letters or symbols.
- After renaming the file, try selecting the video again. If it still doesn’t work, consider moving the file to a simpler directory or folder that doesn’t contain special characters in the path.
Next Steps
In the next lesson, we will move further into the technical side of the setup. You will learn how to connect the sensors themselves, including the Shimmer device for GSR and PPG, and the optional Beam software for eye tracking, and how to calibrate them so that the data you record is reliable.