Introduction
This lesson teaches you to analyse one respondent at a time in the Analysis tab, read the biosignal traces in sync with the video, and write short, time-coded comments that describe what happened in the scene when the body reacted.
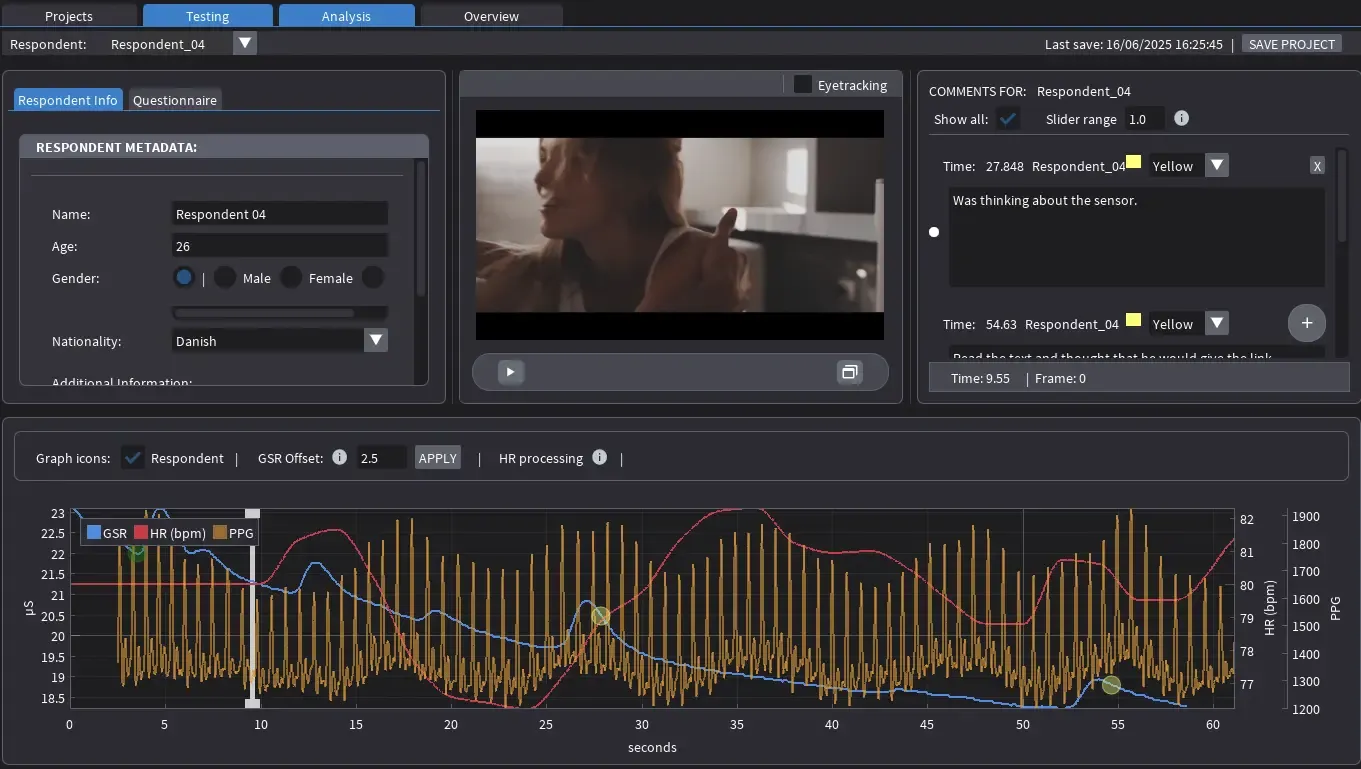
View of the Analysis Panel with all available features and options
The Analysis tab is the central environment for reviewing and interpreting recorded sessions. It presents synchronised playback of the test video alongside physiological data from a single respondent, allowing analysts to examine how the viewer’s body reacted to specific cinematic events. The interface is divided into several functional areas: respondent metadata, video playback, comments, and the biosignal graph.
At the top, a dropdown selects which respondent’s session to view. The left panel lists demographic details, while the video window in the centre provides frame-accurate playback linked to the biosignal traces below. On the right, the comments panel displays all annotations tied to specific timestamps and allows new ones to be created. The lower graph visualises three signals: blue for GSR, red for heart rate, and yellow for the raw PPG waveform.
Understanding the Signals
Understanding the GSR Signal
After selecting a respondent, the interface updates automatically. The GSR line, also known as electrodermal activity (EDA), measures changes in skin conductance resulting from the activity of sweat glands controlled by the sympathetic branch of the autonomic nervous system. In short, it shows how strongly the respondent’s body reacted at each moment of the clip. A reaction here refers to arousal or attention (how alert or engaged the body became), not to emotion such as liking or disliking. It can reveal when something caused a physical response, but not why it felt good or bad. This reaction appears as a short peak in the blue line, a few seconds after the cue.
Understanding the HR and PPG Signals
Heart rate, shown in the software as a red line, represents the interaction between two branches of the autonomic nervous system. The sympathetic branch speeds the heartbeat during effort, stress, or anticipation, while the parasympathetic branch slows it during recovery or calm. In simple words, it shows how the respondent’s overall state of tension changes throughout the clip. A change here refers to effort or load, not to emotion such as pleasure or fear. It can reveal how long a moment kept the viewer engaged, but not what kind of feeling it created. Because of hw the nervous system works, the red line moves more gradually than GSR and is best read as a curve over time rather than as individual peaks. A steady rise often marks growing tension or concentration, while a return toward baseline suggests relief or rest. Reading these longer waves helps identify pacing, rhythm, and energy flow across a scene.
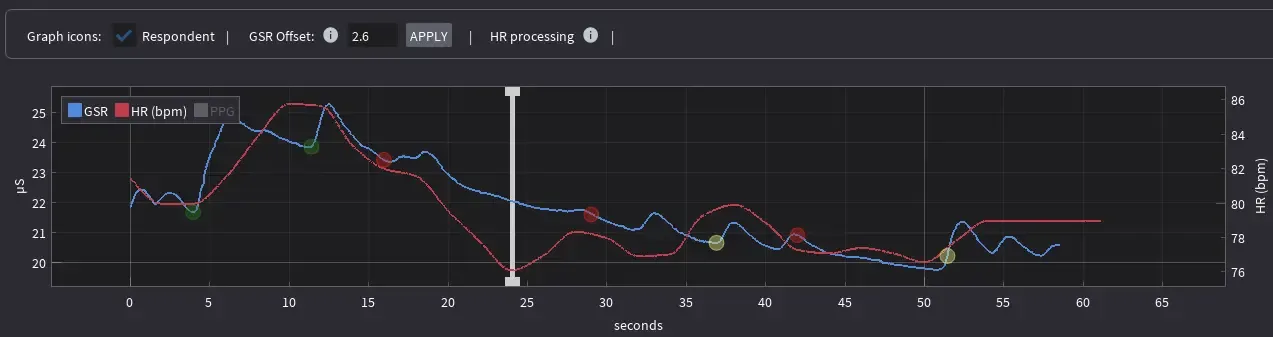
View of the graph section with PPG disabled.
The yellow PPG waveform is used simply to compute heart rate and exists only as a technical quality check. A clean, regular pattern confirms good sensor contact and valid heart-rate data. Irregular, clipped, or noisy waveforms indicate signal loss or motion artefacts. The PPG trace has no interpretive value and should never be linked to creative or emotional meaning.
Interpreting the Data
It is natural, then, to wonder whether these signals can be used to predict emotions. They cannot, but they can reveal where and when the body reacted. The data captures the physical footprint of attention, tension, or surprise. The signals mark the moment of change, but the meaning of that change must come from observation, annotation, and conversation with the respondent.
When examining the graph, the analyst should look for clear peaks, drops, or distinctive patterns in the GSR and heart-rate traces. These moments mark points of interest that can later be explored in conversation. During follow-up, the respondent can be asked to recall and describe those same points using the video or sound as a reference. The graph itself should never be shown directly, as seeing the data can influence or distort the respondent’s memory, leading them to justify the signals rather than describe their genuine experience.
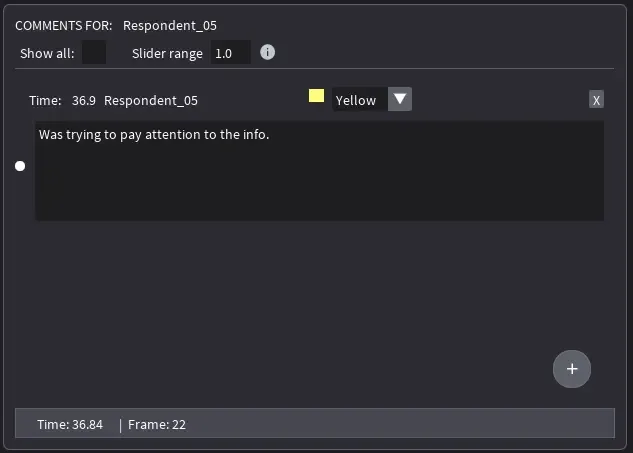
Respondent annotations can be added in the right-hand panel of the Analysis tab. Annotations are automatically timestamped according to the current position of the video playback. The video timeline can be adjusted by dragging the playhead on the graph forward or backward to set the desired moment before adding a comment.
Each respondent should be approached in the same way: the analyst reviews the signals first, then guides a neutral discussion about what the respondent noticed, remembered, or felt during those moments. This method preserves the integrity of both the data and the narrative insight, ensuring that physiological reactions remain objective while interpretation stays grounded in the respondent’s own words.
Evaluate GSR delay: what it is and how to fix it
GSR delay is the normal lag between an on-screen cue and the rise of the GSR curve. It is physiological, not a software fault. The sympathetic signal travels to the sweat glands and the glands fill before conductance changes, so the blue line typically rises about 2-3 seconds after the cue (often in the 1-3 second range). In other words, the brain registers the event first; the skin shows it shortly after.
Alignment should correct only for extra shifts introduced by recording or clock drift. A suitable check is to locate a sharp cue, such as a sudden sound or visual cut, and note the time between that cue and the first upward movement of the GSR curve. If all reactions appear consistently early or late, the GSR Offset control above the graph can be adjusted in small increments and applied.
Large or irregular delays that change across the session usually indicate quality issues rather than genuine differences in reaction time. Loose straps, cable tension, hand movements, or changes in skin temperature can all cause these distortions.